Various data presentations in a graphic form such as schemas, charts, tables, timelines.
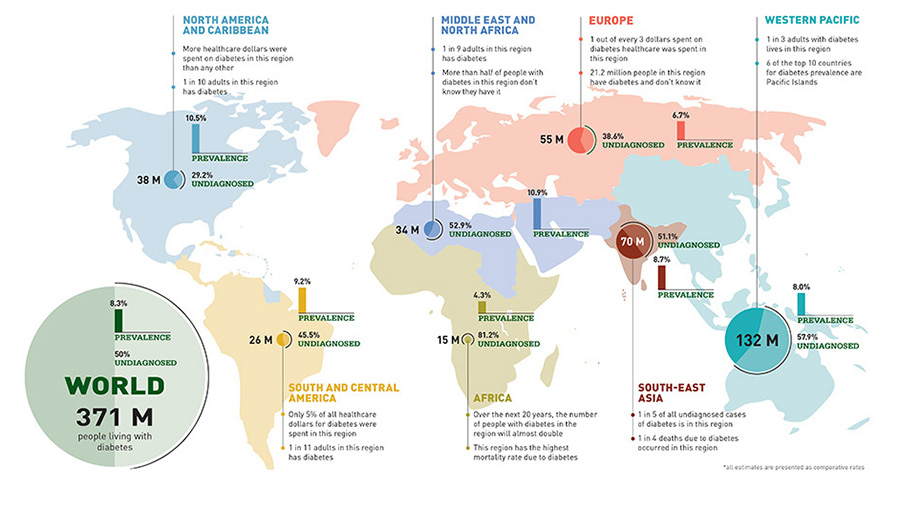
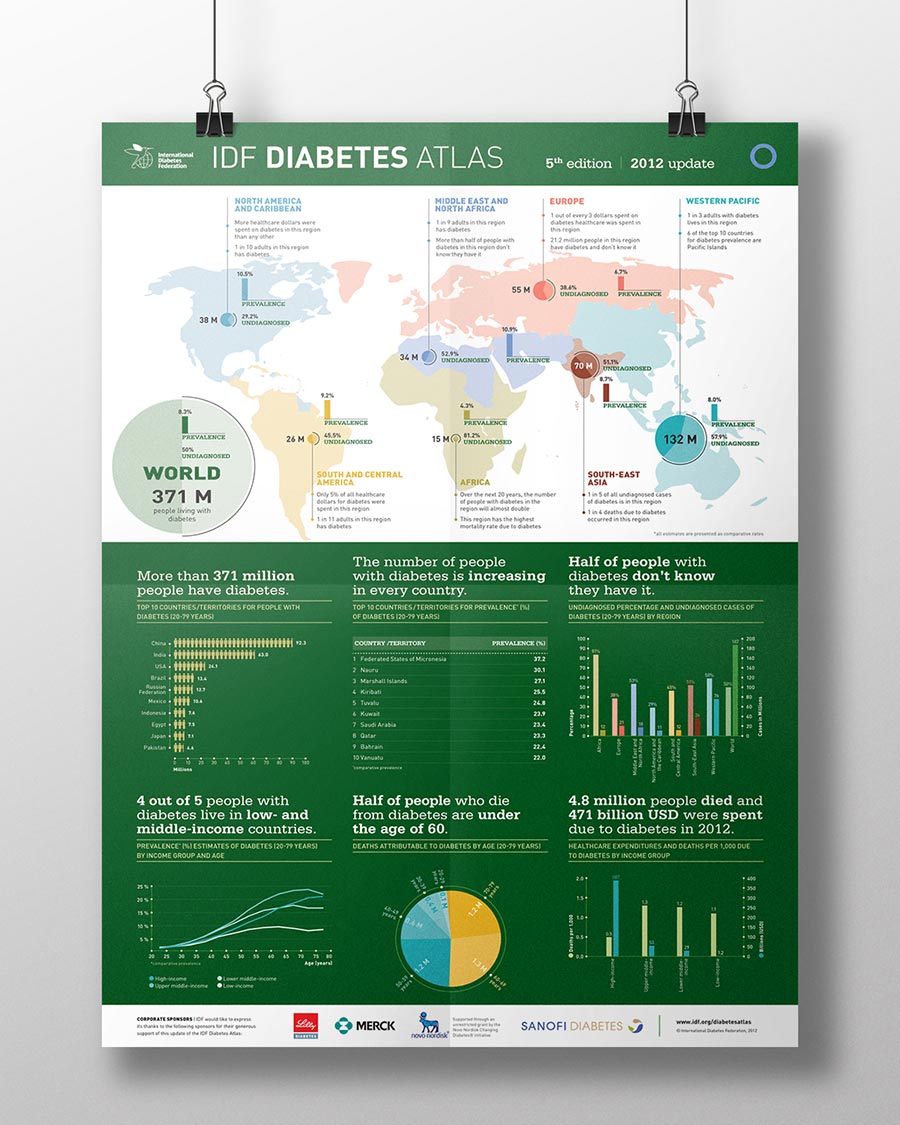
IDF Atlas poster update
Poster with data visualization of diabetes prevalence around the world.
2012 data update of “IDF Atlas 2011”, a biennial publication about diabetes and its statistics.
__
Infographics, graphic design
__
Client: International Diabetes Foundation @ De Visu Digital Document Design
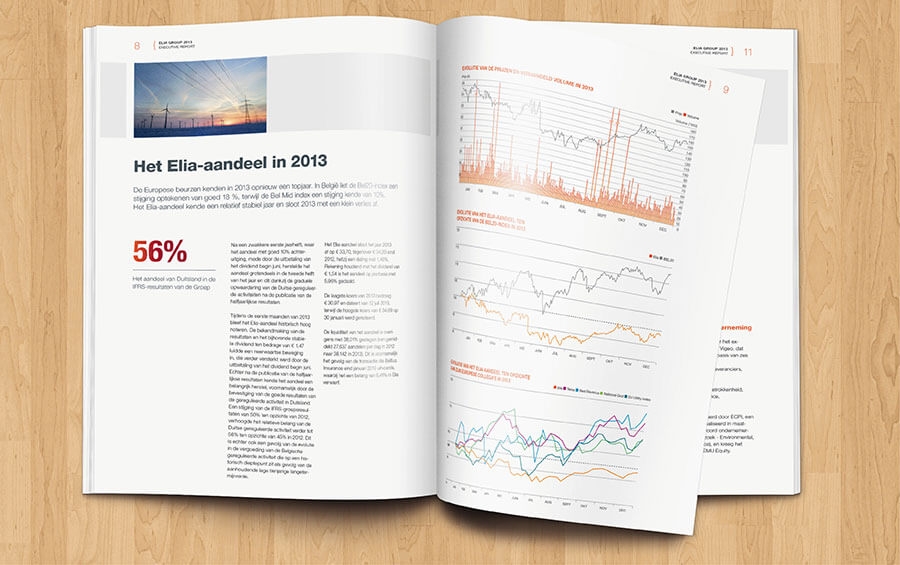
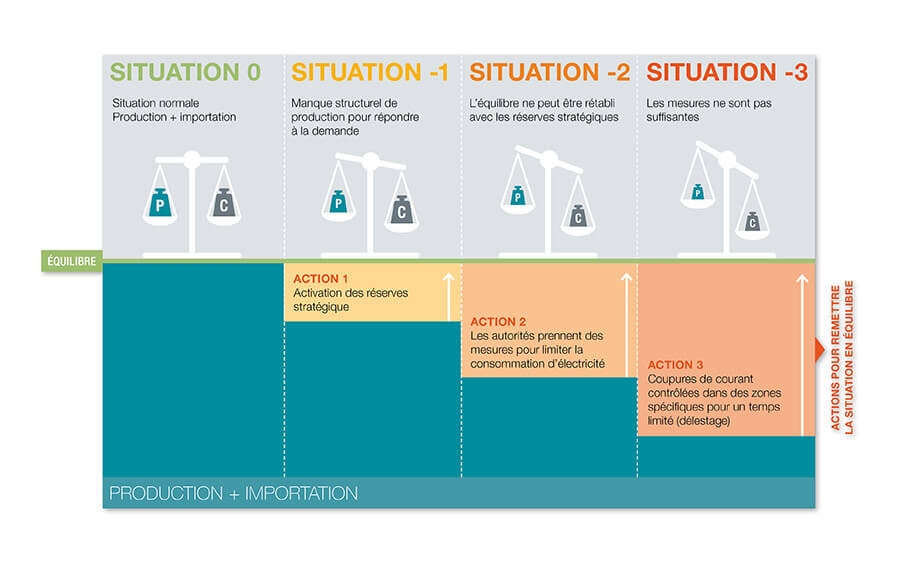
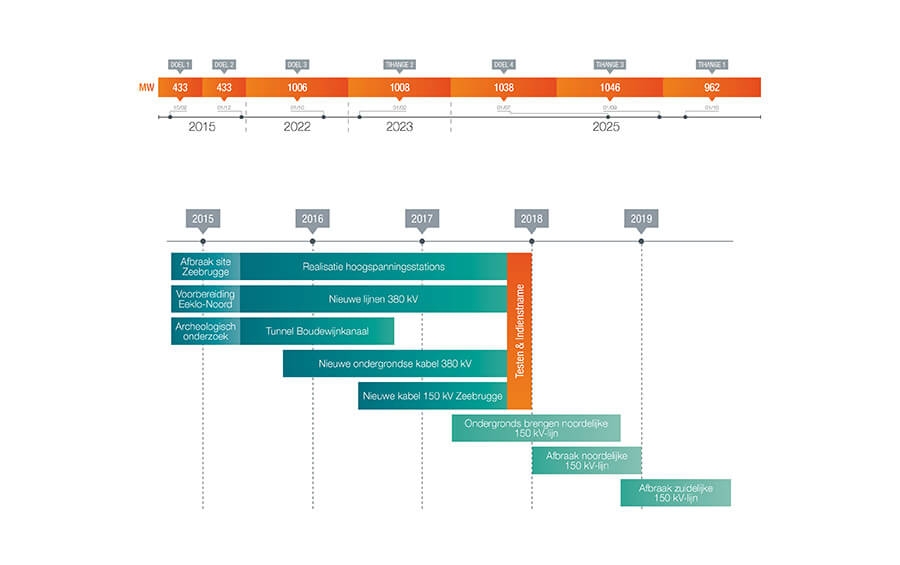
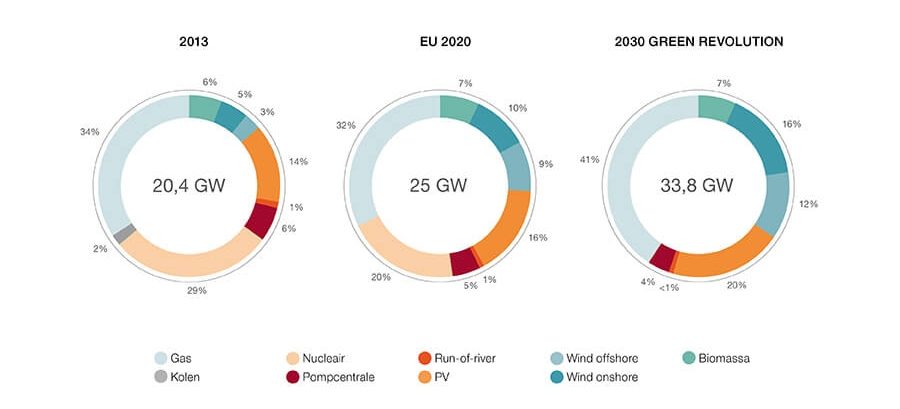
Elia
Conception and design of multiple custom graphics for illustration purposes of various publications for Elia, Belgium’s electricity transmission system operator.
__
Client: Elia @ Studio Witvrouwen
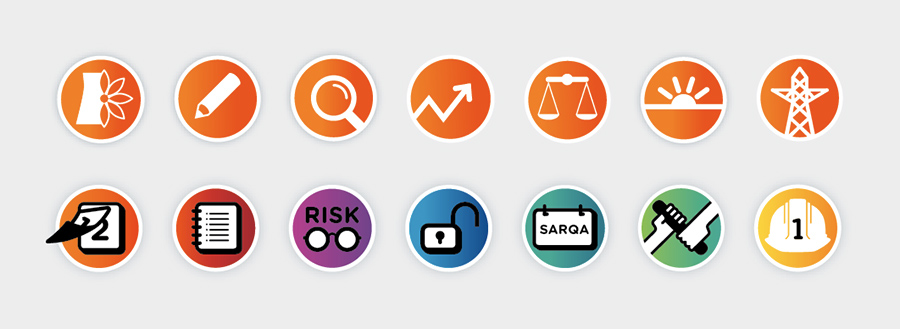
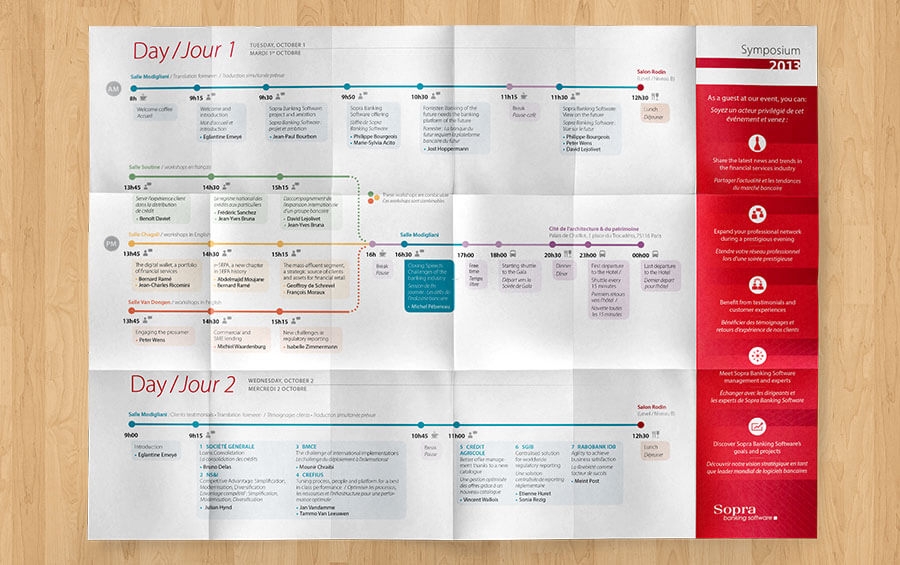
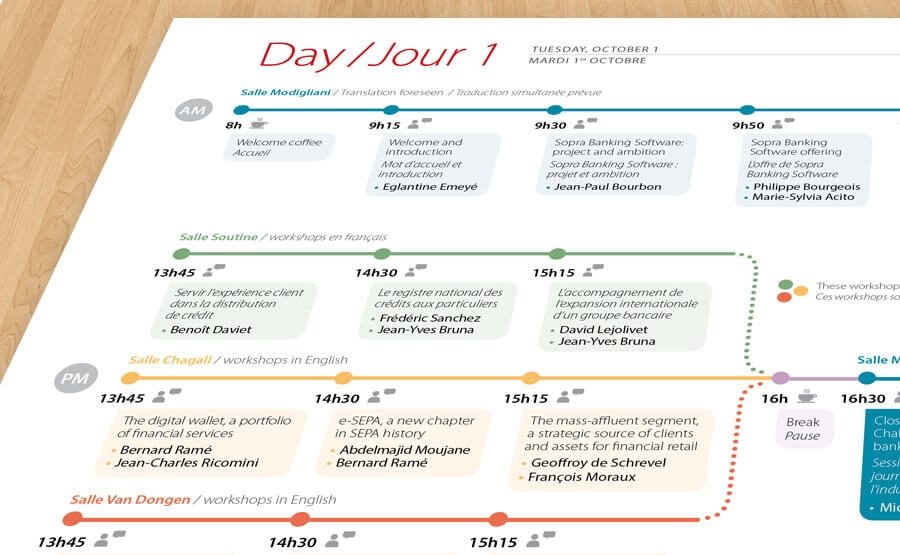
Sopra symposium program
Symposium program is presented in a form of a timeline. A colour code helps to distinguish different conference rooms. Creation of custom pictograms which contribute to a more efficient identification of information. Folded, the program fits in a pocket.
__
Client: Sopra @ Studio Witvrouwen
A day in the media
Visualisation of a random day in media. The infographic illustrates a comparison of the content of two daily newspapers from two different countries: Le Soir (Belgium) and Delo (Slovenia). The content was analysed and divided into 6 categories displayed with a colour code (news, economy, sports, culture…). Each of the articles was numbered and tagged with a key word appearing on the geographical location on the map and on a timeline.
1000 x 700 mm
__
Concept, analysis, graphic design
__
Personal project


— Timeline of the apparition of articles and their length displayed with word count.